Here is a story that plays out in agencies more often than anyone admits. Revenue climbs from $20,000 a month to $30,000 and then $40,000. The team grows. The client list grows. The owner feels busy and, by every visible measure, successful. And yet the bank balance doesn’t move, the owner’s own pay is unreliable and the end of every quarter feels tight.
What went wrong isn’t a mystery. Revenue measures how much money comes in. It says nothing about how much is left after paying for the work. And that’s the question that decides whether an agency is a business or a job with extra steps.
This guide answers what is agency profit margin in plain language: what it measures, how it differs from revenue, how gross, operating and net margin each tell you something different, how to calculate them with agency-specific examples, what separates a healthy margin from a worrying one and how to improve yours. We’re Wordout Media, a white label partner for agencies, so we’ll also show where delivery cost fits in. Financial definitions here follow standard accounting usage, and we link to a reference source so you can check them.
The Short Answer
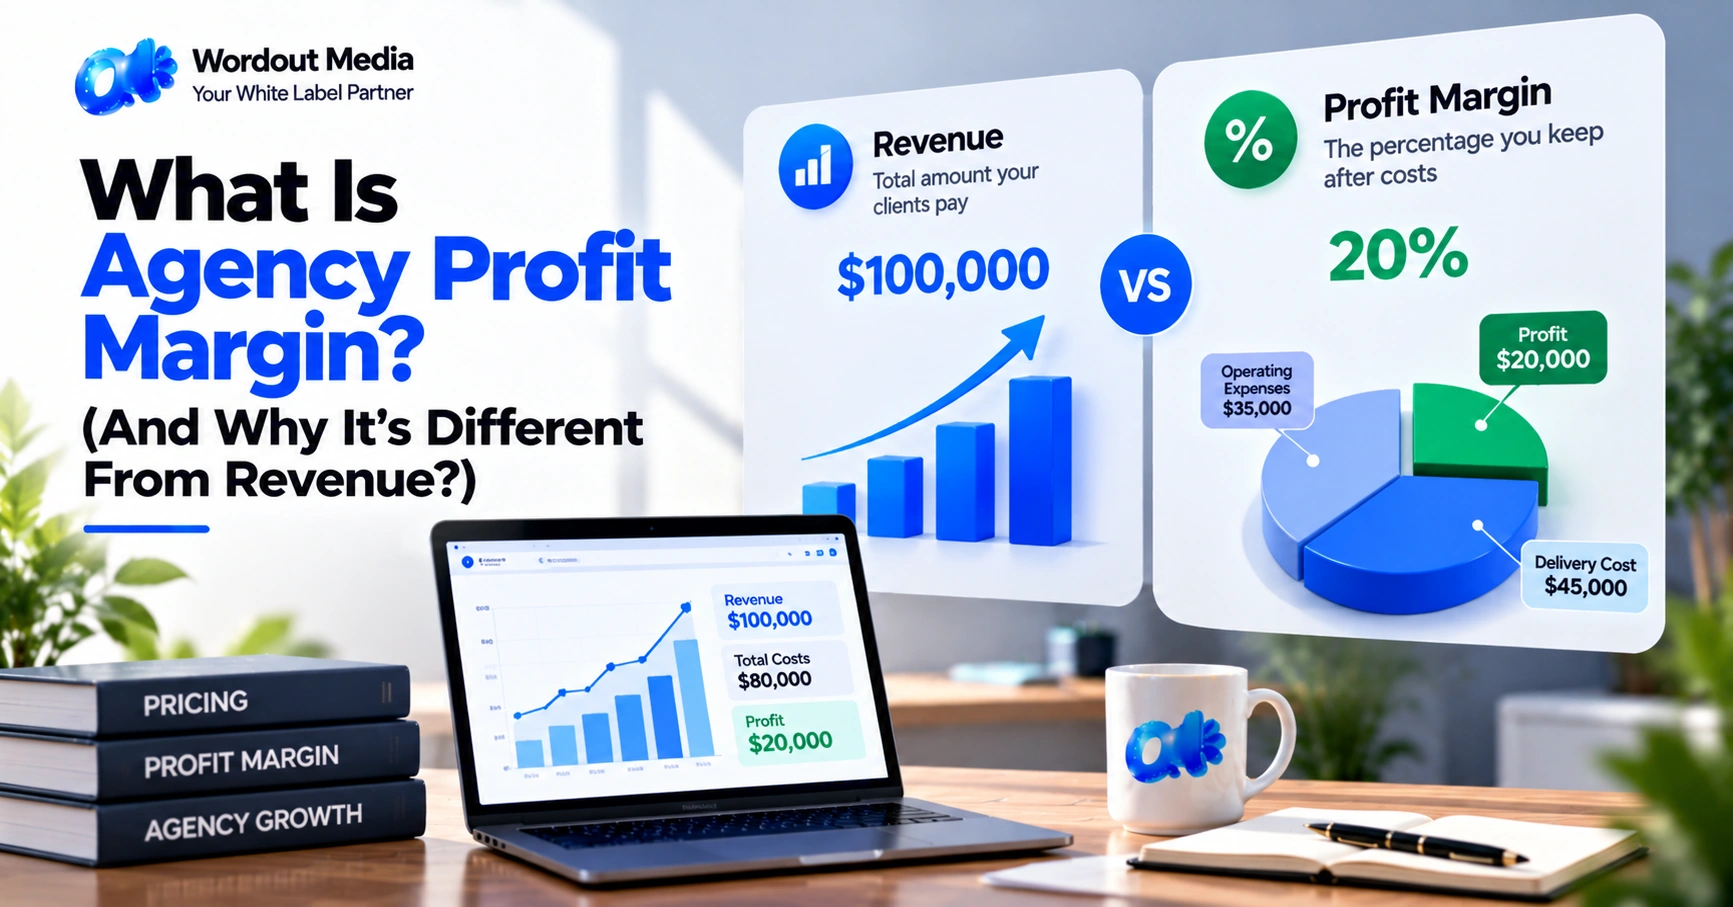
Agency profit margin is the percentage of your revenue that you keep as profit after paying costs.
If a client pays you $1,000 and it costs you $600 to deliver the work, you keep $400. Your margin on that work is 40%. For every dollar that comes in, forty cents stays.
Revenue is the top line. Margin is what remains. A bigger number on the top line only helps if the share you keep doesn’t shrink as it grows.
Revenue vs Profit: The Difference That Decides Everything
Let’s be precise about the two terms, because confusing them is the root of most agency money problems.
Revenue is the total amount your clients pay you. It’s also called sales or the top line.
Profit is what’s left after you subtract costs from revenue.
Margin is profit expressed as a percentage of revenue.
An example. Two agencies each bring in $40,000 a month.
| Agency A | Agency B | |
|---|---|---|
| Revenue | $40,000 | $40,000 |
| Costs | $38,000 | $26,000 |
| Profit | $2,000 | $14,000 |
| Margin | 5% | 35% |
They look identical from the outside. Their revenue matches, their client counts might match, their offices might look equally busy. But Agency B earns seven times more profit. If both lose a $5,000 client, Agency A goes into the red while Agency B is barely affected.
That’s why experienced owners watch margin more closely than revenue.
The Three Types of Margin
“Profit margin” isn’t one number. Standard accounting distinguishes three levels, each answering a different question. The definitions below follow the general accounting usage summarized in the article on profit margin.
1. Gross profit margin
Question it answers: How much do I keep after paying for the direct cost of delivering the work?
Formula: (Revenue − Cost of delivery) ÷ Revenue × 100
For a service business like an agency, “cost of delivery” means the direct costs of producing the work: the labor of the people doing it (employees or outsourced partners), plus any direct expenses such as stock assets or tool licenses used for a specific client. The reference source notes that service companies can use cost of revenue in place of cost of goods sold.
Example: You charge $2,000 for a website. Delivery costs $900. Gross profit is $1,100. Gross margin is $1,100 ÷ $2,000 = 55%.
Use it for: Judging individual projects, clients and services.
2. Operating profit margin
Question it answers: How much do I keep after delivery cost and the cost of running the business?
Formula: Operating profit ÷ Revenue × 100, where operating profit is revenue minus delivery cost minus operating expenses such as rent, software, marketing, admin staff and management time.
Example: On $40,000 of monthly revenue, delivery costs are $18,000 and operating expenses are $12,000. Operating profit is $10,000. Operating margin is 25%.
Use it for: Judging whether the agency’s overall structure works.
3. Net profit margin
Question it answers: How much do I keep after every expense, including interest and taxes?
Formula: Net profit ÷ Revenue × 100.
Example: From that $10,000 operating profit, you pay $1,500 in taxes and interest. Net profit is $8,500. Net margin is 21.25%.
Use it for: Knowing what the business truly earns.
How the three connect
Think of a waterfall:
Revenue → minus delivery cost → gross profit → minus operating expenses → operating profit → minus interest and taxes → net profit.
Each step down leaves a smaller number. Each margin shows you where the leaks are. A strong gross margin with a weak operating margin means delivery is efficient but overheads are too heavy. A weak gross margin means the problem starts at pricing or delivery cost.
Why Agencies Get This Wrong
Agencies are especially prone to margin blind spots. Here’s why.
Time is the main cost, and it’s invisible. In a product business, cost shows up on invoices. In an agency, most cost is people’s time, which doesn’t send an invoice each time it’s used.
Owner time is often free. Many owners do production work and don’t count it as cost. That flatters margin until they try to hire someone to replace themselves.
Revenue is celebrated, cost is ignored. Closing a big client feels like success. The extra hours it takes rarely get measured.
Scope creep hides inside retainers. A retainer priced for 20 hours quietly becomes 35. Revenue doesn’t change. Margin falls.
Averages hide losers. A healthy average margin can conceal a few unprofitable clients and services.
Confusing margin with markup. More on this next.
Margin vs Markup: The Mix-Up That Costs Real Money
These two terms sound similar and measure different things.
- Margin is profit as a percentage of the selling price.
- Markup is profit as a percentage of cost.
The reference source gives a clear illustration: buy something for $40 and sell it for $100, and the markup is 150% ($60 ÷ $40) while the margin is 60% ($60 ÷ $100).
Now an agency example. A project costs you $500 to deliver. You decide to “add 50%,” so you charge $750. You’ve applied a 50% markup. Your margin is $250 ÷ $750 = 33.3%, not 50%.
If you wanted a 50% margin, you’d need to charge $1,000. The formula is:
Price = Cost ÷ (1 − Target Margin)
$500 ÷ (1 − 0.50) = $1,000.
We cover pricing in more depth in How to Price Digital Marketing Services for Maximum Profit.
What Counts as Cost in an Agency?
To measure margin properly, you need to know which costs go where.
Direct costs (delivery cost)
These belong in gross margin.
- Production labor. Salaries and benefits for the people who do client work, or fees paid to a white label partner.
- Direct client expenses. Stock assets, plugins, licenses and tools bought for a specific client.
- Freelancers and contractors used on client work.
- Your own production time. If you personally do client work, assign a fair hourly cost to it.
Operating expenses
These sit below gross margin.
- Rent and utilities
- General software and subscriptions
- Marketing and sales
- Admin and finance staff
- Management time that isn’t tied to specific clients
- Insurance, accounting and legal fees
Below the line
- Interest
- Taxes
A common mistake is putting everything into one pile. Separate direct costs from overheads, and you can see which clients and services earn their keep.
The True Cost of an Employee Hour
Because labor is the biggest cost, it’s worth knowing how to calculate an hour correctly.
Employer costs go well beyond the paycheck. According to the U.S. Bureau of Labor Statistics’ Employer Costs for Employee Compensation release for June 2026, total employer compensation costs for private industry workers averaged $46.89 per hour worked. Wages and salaries made up 70.0% of that ($32.82), and benefits made up 30.0% ($14.07).
That’s an average across all private industry, not marketing agencies specifically, so don’t treat it as your number. But it illustrates the principle: the true cost of an hour of employee time is meaningfully higher than the wage alone, because benefits and related costs sit on top.
Then there’s productivity. A full-time employee has roughly 2,080 paid hours a year, but not all of them are billable. Holidays, sick leave, training, internal meetings and admin reduce the productive total. Dividing total annual cost by productive hours, rather than paid hours, gives the number that belongs in your margin calculation.
An illustration, with assumed figures: $55,000 salary plus 25% overhead gives $68,750. Divided by 1,560 productive hours, that’s about $44 per productive hour, compared with $26 if you’d simply divided the salary by 2,080 paid hours.
A Worked Agency Example, Step by Step
Let’s run a realistic monthly picture for a small agency. All figures are illustrative.
Monthly revenue: $30,000 from eight clients.
Delivery costs:
- Production staff cost: $13,500
- Freelancers: $1,500
- Direct tools and assets: $500
- Total delivery cost: $15,500
Gross profit: $30,000 − $15,500 = $14,500 Gross margin: 48.3%
Operating expenses:
- Rent and utilities: $1,500
- Software and subscriptions: $800
- Sales and marketing: $1,200
- Admin support: $2,500
- Owner salary: $5,000
- Total operating expenses: $11,000
Operating profit: $14,500 − $11,000 = $3,500 Operating margin: 11.7%
Taxes and interest: $700
Net profit: $2,800 Net margin: 9.3%
Read that picture. Revenue is $30,000 but the business keeps $2,800. A single lost client worth $4,000 a month, with no reduction in cost, would turn the agency loss-making. That’s fragility, and it’s visible only when you calculate margin.
How Delivery Cost Changes the Picture
Delivery cost is usually the largest lever you control. Here’s the same agency, changing only how production is delivered.
Consider a single service. You sell a monthly SEO retainer for $1,500. It takes 25 hours.
| Delivery | Hourly cost | Delivery cost | Profit | Gross margin |
|---|---|---|---|---|
| Internal employee | $44 | $1,100 | $400 | 26.7% |
| White label partner | $10 | $250 | $1,250 | 83.3% |
The outsourced figure leaves out your own briefing and review time. If that’s three hours at $40, add $120: cost becomes $370, profit $1,130, margin 75.3%. Still a major improvement, and a more honest figure.
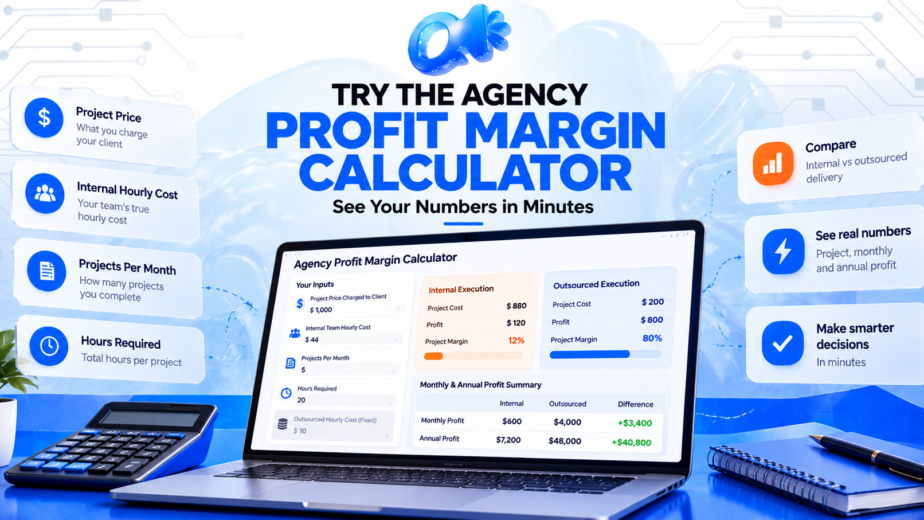
Our rate at Wordout Media is $10 an hour, in blocks of 20 hours ($200), 40 hours ($400) and 80 hours ($800), with the same rate on every block and hours that don’t expire. The Agency Profit Margin Calculator compares internal and outsourced delivery for any project you enter, and our walkthrough How to Use an Agency Profit Margin Calculator the Right Way explains each input.
One important caveat: saved internal hours only become profit if you redeploy them into paid work or reduce cost elsewhere. If the time just becomes idle, the saving is theoretical.
What Is a Good Agency Profit Margin?
People want a single benchmark. We’d be cautious about giving one, for good reasons.
- Margins differ by service. SEO, web design, ads, social and content each have different economics.
- Definitions differ. Some sources quote gross margin before account management, others after. Some include owner pay in costs, others don’t.
- Location and team model matter. Onshore staff, offshore staff and outsourced partners produce very different cost structures.
- Published benchmarks vary in quality. Many come from providers with commercial interests, and sample sizes are often unstated.
For orientation only, one provider’s 2026 pricing benchmark reports typical agency gross margins on white-labeled SEO retainers of roughly 45% to 65% before account management, with a median near 55%. Treat any number like that as a rough guide rather than a standard, since it comes from a vendor and covers one service. The Nico Digital benchmark states its sources and ranges, and you can judge them yourself.
A better way to set your own target is to work backward.
- Decide the net profit you want.
- Add your operating expenses.
- Calculate the gross profit needed to cover both.
- Divide by expected revenue. That’s your required gross margin.
- Compare with your current margin by service.
If a service falls short of the required margin, you have four options: raise the price, cut the hours, lower the delivery cost or stop offering it.
How to Improve Your Agency’s Profit Margin
There are five levers. Most agencies should look at all five, in this order.
1. Raise prices
A price increase falls straight to profit if cost stays flat. Agencies underprice more often than they overprice.
2. Control scope
Define deliverables, cap revisions and charge for extras. Unpaid hours are the quietest margin killer. We explore this in Why Being Constantly Busy Is Killing Your Agency’s Profit.
3. Reduce hours per project
Templates, checklists and documented processes cut the time every project takes. See Stop Doing More: Why Smart Agencies Build Systems Instead.
4. Lower delivery cost
Examine how production is staffed. Outsourcing repeatable work to a reliable partner can reduce cost per hour considerably, and it turns a fixed cost into a variable one. Compare options in White Label vs. In-House Marketing Team.
5. Improve utilization
Idle paid capacity is wasted margin. Variable-cost delivery, such as buying outsourced hours only when you need them, avoids paying for time you aren’t using.
Metrics to Track Alongside Margin
Margin is the headline number. These help you understand it.
- Margin by client. Which clients are profitable and which aren’t.
- Margin by service. SEO, web, social, ads and so on.
- Effective hourly rate. Revenue divided by hours actually worked.
- Utilization rate. Billable hours as a share of available hours.
- Revenue per employee. A rough efficiency measure.
- Client concentration. How much revenue depends on your largest clients.
- Scope creep rate. Actual versus budgeted hours on retainers.
You can start simply. A spreadsheet with revenue, hours and cost per client, updated monthly, will tell you more than most dashboards.
Common Mistakes When Measuring Agency Profit Margin
Leaving out owner time. If you do production, charge it as a cost. Otherwise your margin collapses the day you hire someone.
Using salary instead of loaded cost. Include benefits, taxes, software and equipment.
Dividing by paid hours. Use productive hours.
Counting only production hours. Include meetings, revisions, emails and project management.
Confusing markup with margin. Check which one you mean every time.
Measuring once. Costs and hours change. Recalculate at least quarterly.
Only looking at the total. Profit by client and service shows the problems.
Ignoring cash flow. Margin is not cash. A profitable agency with slow-paying clients can still run short.
A Simple Monthly Routine
Make margin part of your rhythm.
- Weekly: Check hours logged against budget on your biggest accounts.
- Monthly: Calculate gross margin by client and service. Note which are below target.
- Quarterly: Re-check hourly cost, pricing and overheads. Set actions.
- Annually: Review pricing, services and delivery model against your profit goals.
Ten minutes a month of honest arithmetic beats a year of vague optimism.
Frequently Asked Questions
What is agency profit margin?
It’s the percentage of revenue you keep as profit after paying costs. Gross margin looks at delivery cost only, operating margin includes running costs and net margin is after all expenses including interest and taxes.
How is profit margin different from revenue?
Revenue is the total money coming in. Margin is the share of that revenue that remains as profit. Two agencies with the same revenue can have very different margins.
How do I calculate agency profit margin?
Subtract your costs from revenue to get profit, divide profit by revenue and multiply by 100. For project-level margin, use the project price and the cost of delivering it.
What’s the difference between margin and markup?
Margin is profit divided by price. Markup is profit divided by cost. A 150% markup equals a 60% margin.
What should be included in delivery cost?
Production labor (employees, freelancers or a white label partner), direct tools and assets and your own time on client work.
What is a good profit margin for a marketing agency?
It depends on the service, location and team model. Set your own target by working backward from the net profit you need and your overheads, rather than relying on a generic benchmark.
How can outsourcing affect my margin?
If a partner’s hourly rate is lower than your internal cost per productive hour, delivery cost falls and gross margin rises, even after you add your own review time. Savings only become profit if the freed time is used well.
How often should I check my margins?
Review them monthly by client and service, and recalculate your hourly cost and pricing at least quarterly.
So, what is agency profit margin? It’s the measure of whether your agency’s growth is real. Revenue shows how busy you are. Margin shows whether being busy pays. Gross, operating and net margin each tell part of the story, and together they show where money enters, where it leaks and what remains.
Start with your last five projects. Calculate gross margin on each. Compare against the target you actually need. Then look at the five levers and pick the one that will move your number most.
Try the Free Agency Profit Margin Calculator
You don’t need a spreadsheet to see your first numbers.
Try the free Agency Profit Margin Calculator on our homepage. Enter a project price, your internal hourly cost, projects per month and hours required, and it shows your internal margin, your outsourced margin at $10 an hour and the monthly and annual difference. When you’re ready to test outsourced delivery on real work, claim your 8-hour free trial.
You can also read our FAQs or see our services.